Record s20271
  • Age: 61
  • Sex: Male
HR
Updating...
Paper speed: Zoom: mm/second
Amp: mm/mV
Show III, aVR, aVL, aVF
Show 12 leads
  • Filters
    • Smooth
    • Baseline correction
  • QRS intervals
    • Heart rate
    • RR intervals
  • Paper speed
    • 5 mm/second
    • 10 mm/second
    • 25 mm/second
    • 50 mm/second
    • 100 mm/second
  • Amplitude
    • 2 mm/mV
    • 5 mm/mV
    • 10 mm/mV
    • 20 mm/mV
    • 40 mm/mV
  • Show/hide leads
    • -
    • Digital calipers mode
    • -
    • Zoom in
    • Zoom out
    • -
    • Increase channels spacing
    • Decrease channels spacing
    • -
    • Enter fullscreen
      Exit fullscreen
    Save as:

    Additional data

    • Comments

        Records s20271, s20272, s20273 and s20274 are from the same patient.
        This is the first record.
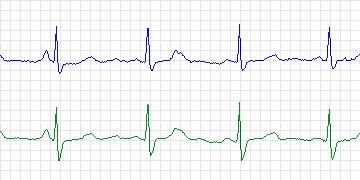
        Lead 0:
          This record shows multiple episodes of ischemia which
          typically show T-wave peaking followed by significant
          ST depression. Some episodes trigger the ischemic
          episode definition during the ST elevation, while
          others trigger only at the onset of ST-depression.
          In still other cases there is a short interval of
          "near-baseline" ST between the elevations (peaking
          of Ts) and depressions which causes a double counting
          of the biphasic episode as two separate episodes.
          This occurs at: 6:41:32, 16:48:58, 18:33:00,
          21:21:48, 21:36:10 and 23:36:22.
          Physiologically each of these represents a single
          episode of ischemia. At 15:18:52, there is a short
          axis shift which interrupts the terminal portion of
          an ischemic episode, resulting in artifactual early
          termination of the ischemic episode, and the definition
          of a second episode.
        Lead 1:
          At approximately 6:41:36 the terminal portion of the
          ischemic episode is split into additional episodes -
          but all represent the resolution phase of the ischemic
          episode. T wave peaks, T-wave peaking decreases, and
          finally ST depression resolve.
          At 7:21:20, double positive peak in ST trend at beginning
          of this episode is created by the superposition of
          rate-related ST-depression. At 15:18:52, see note above
          for lead 0. At the end of this record the data has a
          number of episodes labeled as "rate-related".
          At 16:52:48, axis shift annotation set between the end
          of ischemic episode and local reference.
        Electrode locations were not recorded.
    • Diagnoses: Coronary artery disease
    • Treatment

      • Medication

            Isordil
            Nitroglycerine
            Calcium channel blocker
            Aspirin
      • Balloon Angioplasty: Yes
      • Coronary Artery bypass Grafting: No
    • History

      • Comments: Angina
      • Hypertension: No
      • Left ventricular hypertrophy: No
      • Cardiomyopathy: No
      • Valve disease: No
      • Electrolyte abnormalities: No
      • Hypercapnia, anemia, hypotension, hyperventilation: No
      • Atrioventricular nodal conduction delay: No data
      • Intraventricular conduction block: No data
      • Previous Myocardial Infarction: No
      • Previous tests

        • ECG stress test

          • Thallium/Stress echo: No data
          • Left ventricular function: No data
          • Echocardiogram: No data
          • Coronary Arteriography: Lesions in left anterior descending coronary artery, left circumflex coronary artery
          • Baseline ECG: No data
      • Holter Recording

        • Date: 27/05/1992
        • Recorder: No data
      comments powered by Disqus